The NBA is in the midst of a game style shift. The 3-point shot is being attempted at record high numbers, and virtually every other shot at record lows. I’m interested to see how 3-point attempts (3PA) have changed in recent years and if there’s been an effect on rookies becoming more long-ball focused. As an unrelated bonus, I’m going to look at Dean Oliver’s “Four Factors of Basketball Success” when compared to championship teams.
I’ll begin by loading tidyverse, ggrepel, and gt.
library(tidyverse)
library(ggrepel)
library(gt)
First up: 3PA per game by each team. It’s obvious that Stephen Curry catapulted 3-point shooting to where it is today. I’m interested to see how his voluminous 3-point shooting has affected the league since his Finals-winning 2014-15 season (shot 44% on 8.1 3PA).
Loading in data.
threepoint <- read_csv("~/Desktop/SPMC 350 Files/homework/data/threepointattempts.csv")I’ll look at just 3-point stats. Furthermore, I have to mutate two fields. 3Ppct (multiplying by 100 to get a readable percentage) and 3Pgame (3PA divided by games = 3PA/game).
threepoint <- threepoint %>%
  select(Season, Team, G, `3P`, `3PA`, `3Ppct`) %>%
  mutate(
    `3Ppct` = ((`3Ppct`) * 100),
    `3Pgame` = ((`3PA` / G))) -> threepoint
I need each team’s 3-point statistics. I’ll make a new data frame called nba. This way each team has a respective line on my chart.
nba <- c("Golden State Warriors", "Los Angeles Lakers", "Los Angeles Clippers", "Sacramento Kings", "Phoenix Suns",
         "Dallas Mavericks", "Memphis Grizzlies", "San Antonio Spurs", "New Orleans Pelicans", "Houston Rockets",
         "Utah Jazz", "Denver Nuggets", "Portland Trail Blazers", "Minnesota Timberwolves", "Oklahoma City Thunder",
         "Philadelphia 76ers", "Brooklyn Nets", "New York Knicks", "Boston Celtics", "Toronto Raptors",
         "Milwaukee Bucks", "Indiana Pacers", "Chicago Bulls", "Cleveland Cavaliers", "Detroit Pistons",
         "Atlanta Hawks", "Miami Heat", "Washington Wizards", "Charlotte Hornets", "Orlando Magic")

threepoint <- threepoint %>%
  filter(Team %in% nba)
I want to single out three teams. 1) Golden State Warriors, because of their high volume 3-point shooters, Steph Curry and Klay Thompson. 2) Houston Rockets, thanks in large part to James Harden and his insane 11.9 3PA per game during a three-year stretch. 3) The most important team, the Minnesota Timberwolves… you’ll see why.
threepoint %>%
  filter(Team == "Golden State Warriors") -> GSW
threepoint %>%
  filter(Team == "Houston Rockets") -> HOU
threepoint %>%
  filter(Team == "Minnesota Timberwolves") -> MIN
Let’s chart each team’s 3PA per game from the 2014-15 season to today, including this season so far.
ggplot() +
geom_line(data = threepoint, aes(x = Season, y = `3Pgame`, group = Team), color = "grey", alpha = 0.2) +
geom_line(data = GSW, aes(x = Season, y = `3Pgame`, group = Team), color = "#1D428A", alpha = 0.3, linetype = "twodash") +
geom_line(data = HOU, aes(x = Season, y = `3Pgame`, group = Team), color = "#CE1141", alpha = 0.3, linetype = "dashed") +
geom_line(data = MIN, aes(x = Season, y = `3Pgame`, group = Team), color = "#78BE20", alpha = 1) +
#Team names
geom_text(aes(x = 2018.5, y = 44.8, fontface = 2), label = "Rockets", color = "#CE1141", size = 3, alpha = 0.4, angle = 18) +
geom_text(aes(x = 2018.5, y = 32.7, fontface = 2), label = "Warriors", color = "#1D428A", size = 3, alpha = 0.4, angle = 32) +
geom_text(aes(x = 2018.5, y = 26.7, fontface = 2), label = "Timberwolves", color = "#78BE20", size = 3, angle = 35) +
#2015 3PA rankings
geom_text(aes(x = 2015.2, y = 33.3), label = "1st", color = "#CE1141", size = 3, alpha = 0.4, angle = -10) +
geom_text(aes(x = 2015.2, y = 26.8), label = "4th", color = "#1D428A", size = 3, alpha = 0.4, angle = 25) +
geom_text(aes(x = 2015.2, y = 16.1), label = "30th", color = "#78BE20", size = 3, angle = 8) +
#2022 3PA rankings
geom_text(aes(x = 2021.84, y = 37), label = "9th", color = "#CE1141", size = 3, alpha = 0.4, angle = -26) +
geom_text(aes(x = 2021.84, y = 39.8), label = "3rd", color = "#1D428A", size = 3, alpha = 0.4, angle = 15) +
geom_text(aes(x = 2021.84, y = 42.3), label = "1st", color = "#78BE20", size = 3, angle = 28) +
scale_y_continuous(breaks = seq(0,50, by = 10), limits = c(14, 50)) +
scale_x_continuous(breaks = seq(2015,2022, by = 1), expand = c(0,0.17)) +
labs(
title = "How many 3PA per game are teams taking each year?",
subtitle = "Three point attempts have been climbing league-wide, but no team has skyrocketed quite like the T-Wolves.",
caption="Source: Basketball-Reference | By Ethan Peterson",
x = "Season",
y = "3PA per game") +
theme_bw() +
theme(
plot.title = element_text(size = 16, face = "bold"),
axis.title = element_text(size = 9),
plot.subtitle = element_text(size = 9.5),
plot.caption = element_text(size = 8, face = "bold.italic"),
panel.grid.minor = element_blank()
) 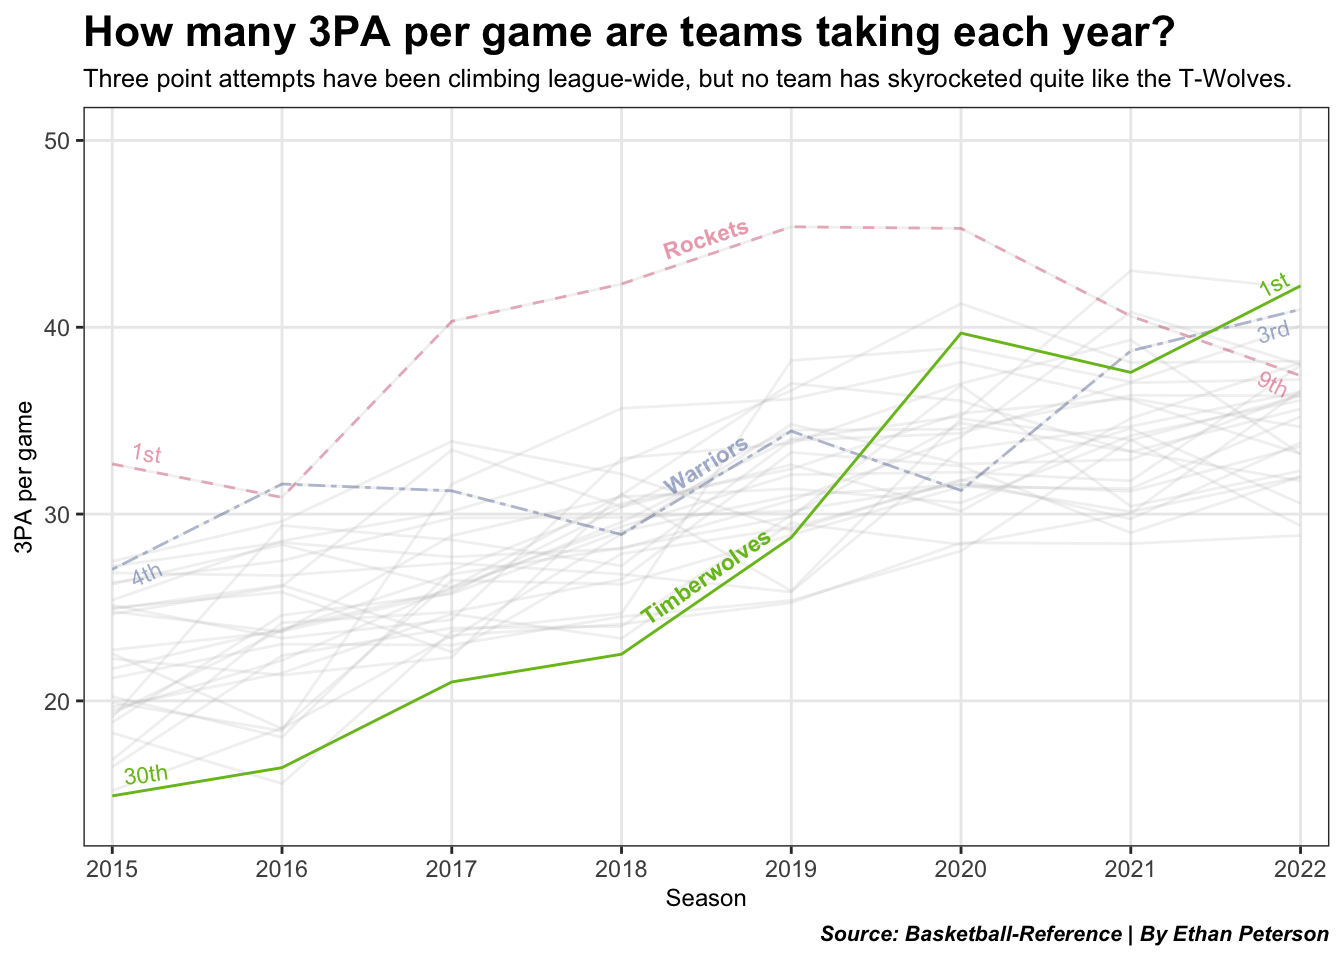 After being 30th in 2014-15 (14.9 3PA/game), Minnesota is 1st this season (42.9 3PA/game) – a 287% increase!
Golden State was always towards the top, but Klay and Steph’s injuries in 2019-20 understandably hurt their production.
The Rockets, finished 1st in five of the last seven seasons. James Harden’s play style led to an insane amount of shots taken from behind the arc. Houston set an unfathomable record 45 3PA/game in back-to-back seasons. With Harden now gone, their attempts have dropped considerably.
Next: player 3PT shooting. The NBA’s young talent has noticeably modeled their game around the 3-point shot. In NBA history, 11 rookies have logged 400+ 3PA. Eight of them debuted after Curry’s rookie season. The Curry effect? Possibly!
Cade Cunningham, currently second in total 3PA and first in 3PA/game for rookies, will be compared to the current rookies in the top 5 for total 3PA. Despite being second in total 3PA, he is on a better trajectory to attempt more threes.
rookies <- read_csv("~/Desktop/SPMC 350 Files/homework/data/nbathreepoint.csv") The current rookie record is held by Donovan Mitchell (550 3PA). As of December 5, 2021, Cade Cunningham is 2nd among rookies with 122 3PA in 17 games (Chris Duarte is 1st, but is averaging 5.5 3PA to Cunningham’s 7.2). Is Cunningham on pace to pass Mitchell’s record?
cade <- rookies %>%
  filter(Player == "Cade Cunningham") %>%
  group_by(Player) %>%
  mutate(CumThreePoint = cumsum(`3PA`))

edwards <- rookies %>%
  filter(Player == "Anthony Edwards") %>%
  group_by(Player) %>%
  mutate(CumThreePoint = cumsum(`3PA`))

mitchell <- rookies %>%
  filter(Player == "Donovan Mitchell") %>%
  group_by(Player) %>%
  mutate(CumThreePoint = cumsum(`3PA`))

lillard <- rookies %>%
  filter(Player == "Damian Lillard") %>%
  group_by(Player) %>%
  mutate(CumThreePoint = cumsum(`3PA`))

doncic <- rookies %>%
  filter(Player == "Luka Dončić") %>%
  group_by(Player) %>%
  mutate(CumThreePoint = cumsum(`3PA`))

young <- rookies %>%
  filter(Player == "Trae Young") %>%
  mutate(CumThreePoint = cumsum(`3PA`))
Using a step chart, I’ll look at each player’s cumulative 3PA, focusing on Cade Cunningham.
ggplot() +
#Player cumulative 3PA
geom_step(data = mitchell, aes(x = G, y = CumThreePoint, group = Player), color = "#00471B", alpha = 0.6) +
geom_step(data = edwards, aes(x = G, y = CumThreePoint, group = Player), color = "#78BE20", alpha = 0.4) +
geom_step(data = lillard, aes(x = G, y = CumThreePoint, group = Player), color = "#E03A3E", alpha = 0.4) +
geom_step(data = doncic, aes(x = G, y = CumThreePoint, group = Player), color = "#00538C", alpha = 0.4) +
geom_step(data = young, aes(x = G, y = CumThreePoint, group = Player), color = "#C1D32F", alpha = 0.4) +
geom_step(data = cade, aes(x = G, y = CumThreePoint, group = Player), color = "#1D42BA", alpha = 1) +
#Player labels
geom_text(aes(x = 10.5, y = 95), label = "Cade Cunningham", color = "#1D42BA", size = 3, alpha = 1, angle = 33) +
geom_text(aes(x = 78.5, y = 560), label = "Donovan Mitchell", color = "#00471B", size = 3, alpha = 0.6) +
geom_text(aes(x = 35, y = 160), label = "Trae Young", color = "#C1D32F", size = 3, alpha = 0.5, angle = 14) +
geom_text(aes(x = 43, y = 305), label = "Anthony Edwards", color = "#78BE20", size = 3, alpha = 0.5, angle = 34) +
geom_text(aes(x = 76, y = 483), label = "Damian Lillard", color = "#E03A3E", size = 3, alpha = 0.3, angle = 27) +
geom_text(aes(x = 59, y = 435), label = "Luka Dončić", color = "#00538C", size = 3, alpha = 0.3, angle = 35) +
theme_minimal() +
scale_y_continuous(breaks = seq(0,500, by = 100)) +
scale_x_continuous(breaks = seq(0,90, by = 10)) +
labs(
title = "Rookie 3-point attempt record to be eclipsed?",
subtitle = "Pistons PG Cade Cunningham is on pace to attempt the most threes by a rookie in NBA history.",
caption="Source: Basketball-Reference | By Ethan Peterson",
x = "Games Played",
y = "3PA") +
theme(
plot.title = element_text(size = 16, face = "bold"),
axis.title = element_text(size = 9),
plot.subtitle = element_text(size = 10),
plot.caption = element_text(size = 8, face = "bold.italic"),
panel.grid.minor = element_blank()
)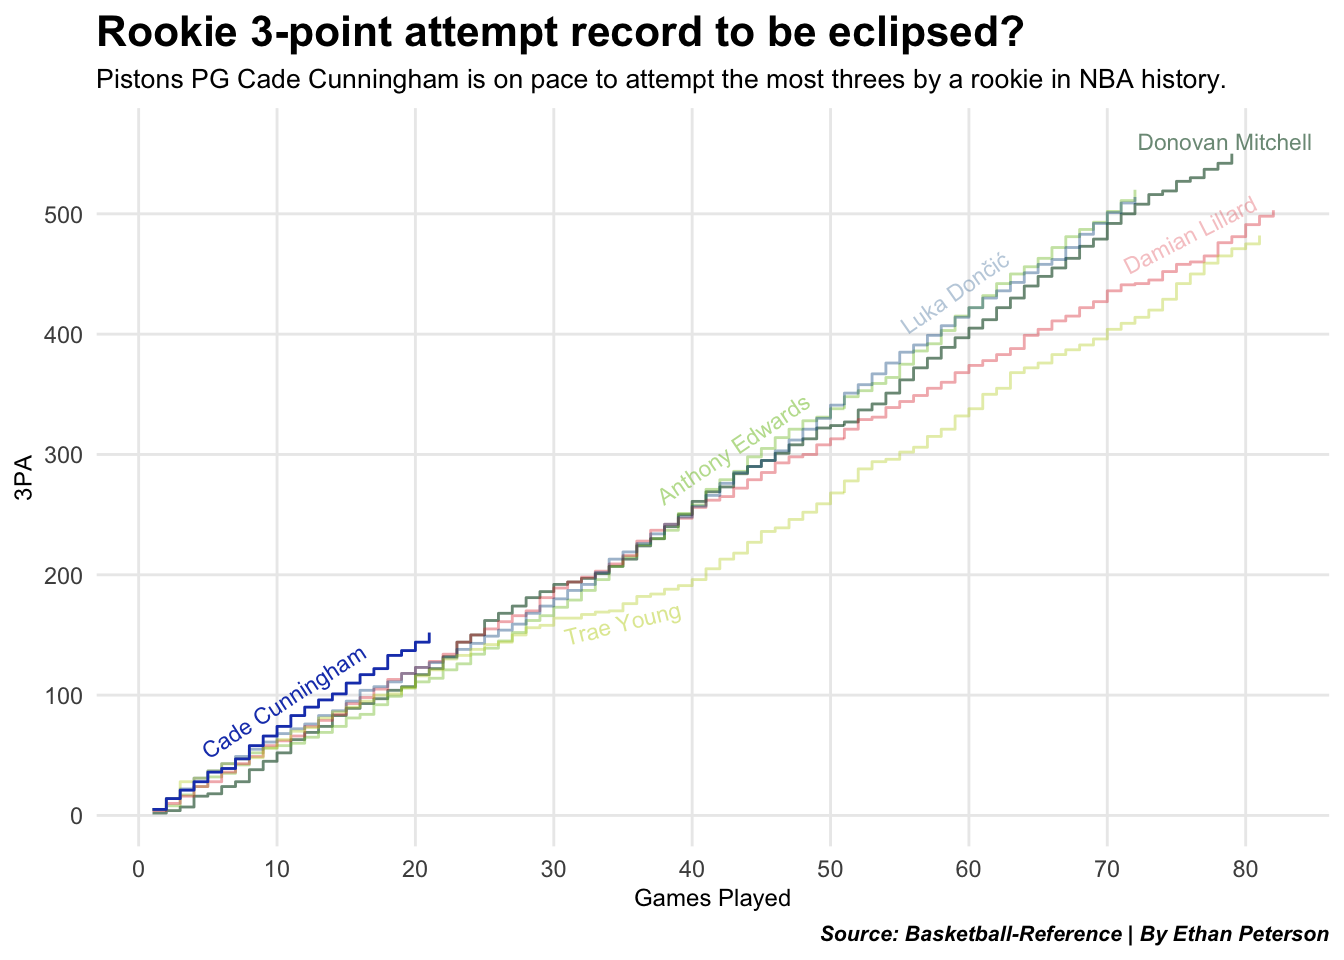 Cunningham is evidently on pace to beat Donovan Mitchell. Through 17 games, his 122 3PA is ahead of Mitchell’s 97. His 3P% is amendable, though (29%). The current top 5 rookies all shot above 32%.
Finally, how do basketball teams win games? Dean Oliver identified what he called the “Four Factors of Basketball Success.” Shooting, turnovers, rebounding, & free throws. He weighted them in order of importance: shooting (40%), turnovers (25%), rebounding (20%); free throws (15%).
Shooting is measured with Effective Field Goal Percentage (eFG%), turnovers: Turnover Percentage (TOV%), rebounding: Offensive and Defensive Rebound Percentage (ORB% and DRB%); free throws by how often a team gets to the line and how often they make them – Free Throws per Field Goal Attempt (FT/FGA).
Oliver’s theory can include up to eight factors (offense & defense metrics). I’ll look at season stats of every championship team since the 1979-80 season and select the necessary stats.
champs <- read_csv("~/Desktop/SPMC 350 Files/homework/data/champs.csv")

champs <- champs %>%
  select(Season, Team, W, L, Pct, `eFG%`, `TOV%`, `ORB%`, FT_FGA, `OppeFG%`, `OppTOV%`, `OppORB%`, OppFT_FGA)
A table will showcase the top 10 championship teams based on Dean Oliver’s success factors. I’m going to mutate and multiply the eight factors by 100 so I have a readable percentage. Then mutate a net value for each category (Net eFG%, Net TOV%, Net ORB%, and Net FT_FGA). This is so we can accurately see if the teams out-performed their opponents in each category. Lastly, mutating the final metric, FourFactorScore, which takes each net value and multiplies it by its respective weight that Oliver listed, then adding them together.
champs %>%
  mutate(
    `eFG%` = (`eFG%` * 100),       #making numbers a readable percentage
    `OppeFG%` = (`OppeFG%` * 100),
    `TOV%` = (`TOV%` * 100),
    `OppTOV%` = (`OppTOV%` * 100),
    `ORB%` = (`ORB%` * 100),
    `OppORB%` = (`OppORB%` * 100),
     FT_FGA = (FT_FGA * 100),
     OppFT_FGA = (OppFT_FGA * 100),
    `Net_eFG%` = (`eFG%` - `OppeFG%`),      #Net values for each factor
    `Net_TOV%` = (`OppTOV%` - `TOV%`),
    `Net_ORB%` = (`ORB%` - `OppORB%`),
     Net_FT_FGA = (FT_FGA - OppFT_FGA),
     FourFactorScore = (`Net_eFG%` * .40) + (`Net_TOV%` * .25) + (`Net_ORB%` * .20) + (Net_FT_FGA * .15)) -> champsstats
I’ll select the W/L records and net statistics.
champsstats %>%
  select(Season, Team, W, L, Pct, `Net_eFG%`, `Net_TOV%`, `Net_ORB%`, Net_FT_FGA, FourFactorScore) -> champstable
Which NBA champion fit Dean Oliver’s model the best?
champstable %>%
  group_by() %>%
  arrange(desc(FourFactorScore)) %>%
  top_n(10) %>%
  gt() %>%
  cols_label(
    `Net_eFG%` = "Net eFG%",
    `Net_TOV%` = "Net TOV%",
    `Net_ORB%` = "Net ORB%",
    `Net_FT_FGA` = "Net FT/FGA",
    FourFactorScore = "Four Factor Score"
  ) %>%
  cols_align(
    align = "center",
    columns = -Team & -Season
    ) %>%
  tab_header(
    title = "Top 10 championship teams by Four Factor Score",
    subtitle = "MJ and the Bulls dominated Dean Oliver's theory of basketball success."
  ) %>% tab_style(
    style = cell_text(color = "black", weight = "bold", align = "left"),
    locations = cells_title("title")
  ) %>% tab_style(
    style = cell_text(color = "black", align = "left"),
    locations = cells_title("subtitle")
  ) %>%
  tab_source_note(
    source_note = md("**By:** Ethan Peterson  |  **Source:** [Basketball-Reference](https://www.basketball-reference.com/leagues/)")
  ) %>%
  tab_style(
     locations = cells_column_labels(columns = everything()),
     style = list(
       cell_borders(sides = "bottom", weight = px(3)),
       cell_text(weight = "bold", size=12))
     ) %>%
  tab_style(
     locations = cells_column_labels(columns = FourFactorScore),
     style = list(
       cell_text(weight = "bold", size=12))
  ) %>%
  opt_row_striping() %>%
  opt_table_lines("none") %>%
  tab_style(
    style = list(
      cell_borders(
        sides = "left",
        color = "black",
        weight = px(2))
    ),
    locations = list(
      cells_body(
        columns = c(FourFactorScore, Team, W, `Net_eFG%`, Season)))
  ) %>%
  tab_style(
    style = list(
      cell_borders(
        sides = "right",
        color = "black",
        weight = px(2))
    ),
    locations = list(
      cells_body(
        columns = c(FourFactorScore)))
  ) %>%
  tab_style(
    style = list(
      cell_borders(
        sides = "bottom",
        color = "black",
        weight = px(2))
    ),
    locations = list(
      cells_body(
        rows = c(10)))
  ) %>%
    fmt_number(
    columns = c(FourFactorScore),
    decimals = 2
    ) %>%
#Adding bold to the highest value in each column
  tab_style(
    style = list(
      cell_text(weight = "bolder", style = "oblique")
      ),
    locations = cells_body(
      columns = `Net_eFG%`,
      rows = c(10)
    )
  ) %>%
  tab_style(
    style = list(
      cell_text(weight = "bolder", style = "oblique")
      ),
    locations = cells_body(
      columns = `Net_TOV%`,
      rows = c(1)
    )
  ) %>%
  tab_style(
    style = list(
      cell_text(weight = "bolder", style = "oblique")
      ),
    locations = cells_body(
      columns = `Net_ORB%`,
      rows = c(1)
    )
  ) %>%
  tab_style(
    style = list(
      cell_text(weight = "bolder", style = "oblique")
      ),
    locations = cells_body(
      columns = Net_FT_FGA,
      rows = c(5)
    )
  ) %>%
#Adding team colors to text
  tab_style(
    style = list(
      cell_text(color = "#CE1141")
      ),
    locations = cells_body(
      rows = Team == "Chicago Bulls")
    ) %>%
  tab_style(
    style = list(
      cell_text(color = "#000000")
      ),
    locations = cells_body(
      rows = Team == "San Antonio Spurs")
    ) %>%
  tab_style(
    style = list(
      cell_text(color = "#552583")
      ),
    locations = cells_body(
      rows = Team == "Los Angeles Lakers")
    ) %>%
  tab_style(
    style = list(
      cell_text(color = "#007A33")
      ),
    locations = cells_body(
      rows = Team == "Boston Celtics")
    ) %>%
  tab_style(
    style = list(
      cell_text(color = "#006BB6")
      ),
    locations = cells_body(
      rows = Team == "Philadelphia 76ers")
    ) %>%
  tab_style(
    style = list(
      cell_text(color = "#FFC72C")
      ),
    locations = cells_body(
      rows = Team == "Golden State Warriors")
)| Top 10 championship teams by Four Factor Score | |||||||||
|---|---|---|---|---|---|---|---|---|---|
| MJ and the Bulls dominated Dean Oliver's theory of basketball success. | |||||||||
| Season | Team | W | L | Pct | Net eFG% | Net TOV% | Net ORB% | Net FT/FGA | Four Factor Score |
| 1995-96 | Chicago Bulls | 72 | 10 | 0.878 | 3.5 | 3.0 | 8.0 | -0.5 | 3.68 |
| 1996-97 | Chicago Bulls | 69 | 13 | 0.841 | 4.0 | 2.3 | 5.2 | 0.3 | 3.26 |
| 1991-92 | Chicago Bulls | 67 | 15 | 0.817 | 4.2 | 2.3 | 4.4 | 0.2 | 3.17 |
| 2007-08 | Boston Celtics | 66 | 16 | 0.805 | 6.5 | 0.5 | 1.0 | 1.4 | 3.14 |
| 1998-99 | San Antonio Spurs | 37 | 13 | 0.740 | 5.6 | -0.8 | -0.1 | 6.1 | 2.94 |
| 1982-83 | Philadelphia 76ers | 65 | 17 | 0.793 | 3.7 | -0.5 | 3.3 | 5.6 | 2.85 |
| 1999-00 | Los Angeles Lakers | 67 | 15 | 0.817 | 4.1 | 0.7 | 3.7 | 1.9 | 2.84 |
| 1986-87 | Los Angeles Lakers | 65 | 17 | 0.793 | 5.2 | -0.2 | 0.4 | 4.8 | 2.83 |
| 1985-86 | Boston Celtics | 67 | 15 | 0.817 | 5.2 | -1.1 | 3.0 | 2.8 | 2.83 |
| 2016-17 | Golden State Warriors | 67 | 15 | 0.817 | 7.7 | 0.3 | -2.3 | 0.6 | 2.78 |
| By: Ethan Peterson | Source: Basketball-Reference | |||||||||
Dean Oliver’s theory worked well within the Bulls system. The 1995-96 Jordan-led team won a then-record 72 wins. Their Net TOV% of 3.0 was highest in the top 10, and a Net ORB% of 8.0 was good for 1st all time, dating back to the 1979-80 championship team. The 1998-99 Spurs excelled at getting to the FT line, and the 2016-17 Warriors shot an impressive 7.7% Net eFG% (1st all time).